
Foundations
S&P 500
What the S&P 500 measures, how float-adjusted market-cap weighting shapes it, and why it is not the entire U.S. market.
Definition
The S&P 500 is an index of 500 leading U.S. companies designed to measure the large-cap segment of the U.S. equity market.
A large-cap gauge
S&P Dow Jones Indices reports that the index contains 500 leading companies and covers approximately 80% of available U.S. market capitalization. That makes it a widely used large-cap benchmark, but not a list of every U.S. public company and not a measure of bonds, private businesses, or non-U.S. markets.
A committee applies published eligibility and maintenance methodology; membership is not simply the 500 largest stocks on a fixed date. Constituents can be added or removed as companies and eligibility change.
Float-adjusted capitalization weighting
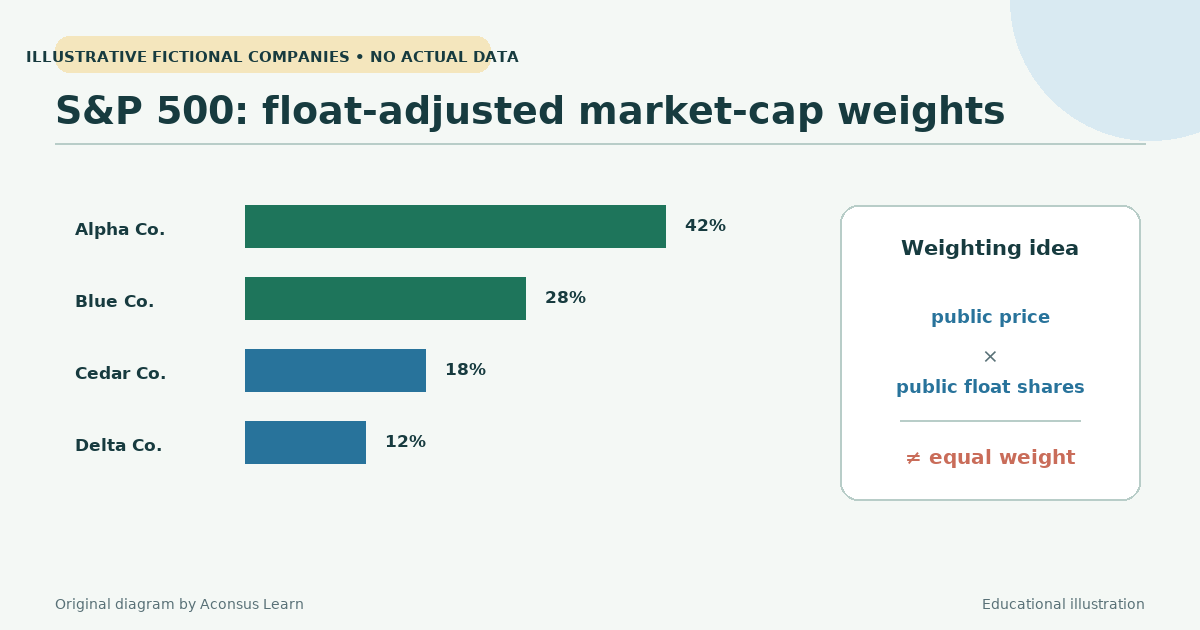
Weights reflect float-adjusted market capitalization, so shares considered available to public investors matter and larger eligible companies have more influence. The index’s return can consequently be dominated by its biggest constituents even though it contains 500 companies.
The familiar headline level is usually the price-return index. Total-return versions incorporate dividends under their calculation rules. A fair long-term comparison must use the same return type and currency.
Benchmark, not an account
An investor cannot buy the index itself. Mutual funds, ETFs, futures, and other products can seek to track or reference it, each with distinct fees, tracking, tax, counterparty, and trading characteristics.
Using the S&P 500 as a benchmark makes most sense for comparable U.S. large-cap exposure. It is not automatically appropriate for a global portfolio or a portfolio containing substantial small companies and bonds. Strong historical returns are not a forecast. Investors comparing a fund should use the corresponding price or total-return version and the same measurement dates.
Hypothetical example
Suppose the index’s float-adjusted market value is $50 trillion and one constituent accounts for $3 trillion. Its approximate weight is 6%, so a 10% move in that company alone contributes about 0.6 percentage point to the index before other constituents move. Five hundred constituents therefore do not each contribute one five-hundredth.
Limitations to keep in mind
- The index is fully exposed to U.S. large-cap equity declines and can be concentrated in its largest companies.
- It omits smaller companies, most foreign markets, bonds, and other asset classes.
- A tracking product can lag the index because of fees, taxes, cash, trading, or structure.
Sources and further reading
- S&P 500 — S&P Dow Jones Indices
- S&P U.S. Indices Methodology — S&P Dow Jones Indices
- Get Off the Bench: A Look at Benchmarks — FINRA
- Market Cap Explained — FINRA
Published ; Reviewed . Automated editorial source comparison; no external certification Claims compared with cited sources: 2
The provider calls the index the best single gauge of large-cap U.S. equities; that evaluative wording was not repeated as fact. Exact coverage changes with market values.