
Returns and valuation
Volatility
Volatility describes how widely and rapidly an investment's price or returns fluctuate.
Definition
Volatility is the degree of price or return fluctuation over a period. It may be observed from past data or implied from option prices, and it is often reported as a percentage; it measures movement, not the full set of investment risks.
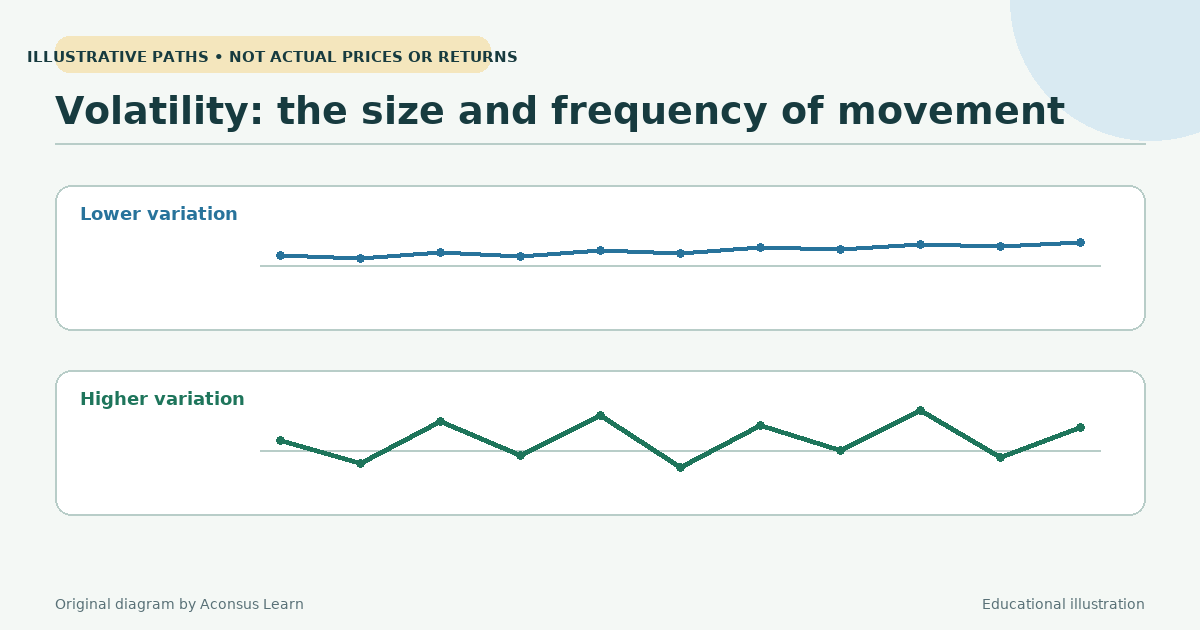
Movement in both directions
FINRA explains volatility through the frequency and size of price movements, often measured by standard deviation. Fidelity describes it as share-price fluctuation in either direction over a short time. A sharply rising security can therefore be volatile just as a sharply falling one can.
Historical volatility summarizes observed variation over a chosen window. Implied volatility is inferred from option prices and reflects market expectations under an option-pricing framework. They answer different questions, and neither predicts the direction of the next move.
Always ask: over what period?
A daily, monthly, or annual calculation can produce different numbers. So can the choice of price returns versus total returns and the amount of history. Comparisons should use the same method and period. Annualized percentages are scaled measures, not a statement that price will move by exactly that amount.
Beta is related but different: it estimates sensitivity to a benchmark, whereas volatility measures an investment's own variation. A low beta does not necessarily mean low total volatility.
Use it as one lens
Volatility matters because large losses require disproportionately large gains to recover. A 20% fall needs a 25% gain to return to the starting value. Investors with near-term withdrawals may be especially vulnerable because selling after a decline locks in fewer assets for a later recovery.
Yet low volatility does not make an investment safe. Stale prices, illiquidity, default risk, or inflation can remain hidden. Combine volatility with risk analysis, liquidity needs, and diversification rather than using it as a complete score.
Hypothetical example
A fund moves from $100 to $110, then $90, then $105. Another stays between $99 and $102. The first shows wider price swings and is more volatile over these observations, even though it finishes higher. Four prices are not enough for a robust statistical estimate, but they illustrate that volatility concerns the path, not only the endpoint.
Limitations to keep in mind
- Volatility estimates depend heavily on the period and method selected.
- Calm historical prices can conceal liquidity, credit, or valuation risk.
- A volatility measure does not forecast the direction of returns.
Sources and further reading
- Volatility — FINRA
- What is volatility and how does it work? — Fidelity
Published ; Reviewed . Automated editorial source comparison; no external certification Claims compared with cited sources: 1
FINRA emphasizes standard deviation and beta; Fidelity distinguishes historical and implied volatility. The article keeps those measures separate.