
Returns and valuation
P/E Ratio
The price-to-earnings ratio compares a share's market price with earnings per share.
Definition
The price-to-earnings ratio, or P/E, is share price divided by earnings per share. A trailing P/E uses historical earnings, while a forward P/E uses estimates; the ratio needs context and can be meaningless when earnings are zero or negative.
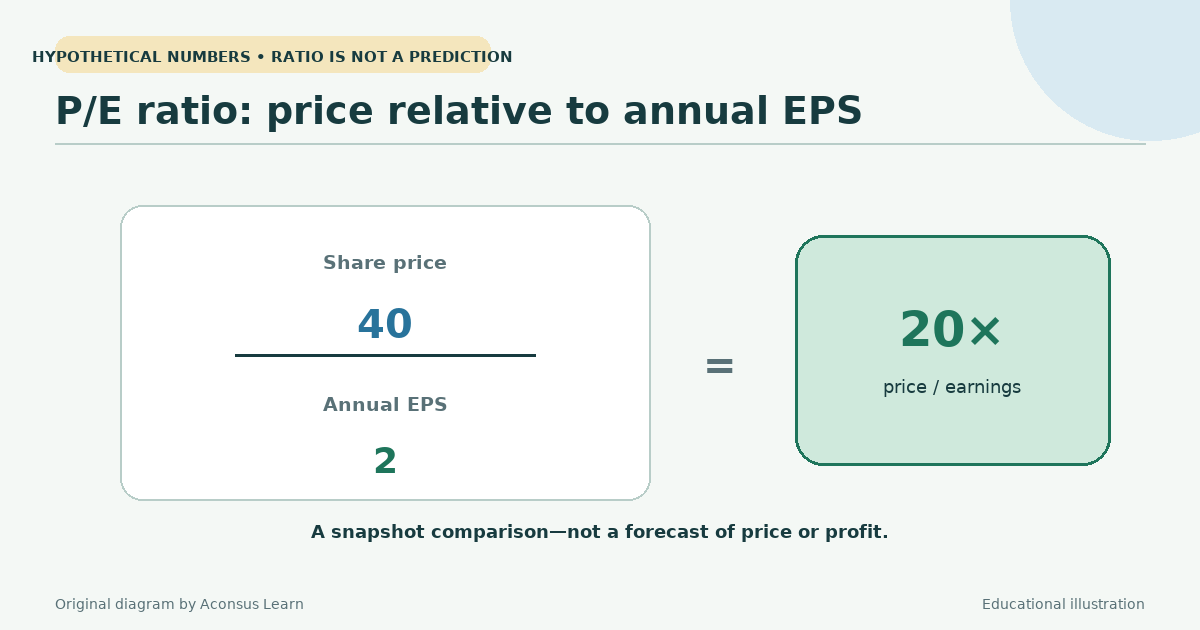
Price for each unit of earnings
Nasdaq defines P/E as current stock price divided by trailing or expected annual earnings per share. Fidelity gives the same core formula and identifies it as a valuation ratio. If a stock costs $30 and trailing earnings are $2 per share, its trailing P/E is 15.
The numerator and denominator must be compatible. A per-share price goes with per-share earnings; equivalently, market capitalization can be compared with total net income when definitions align. Adjusted earnings, continuing operations, and diluted versus basic share counts can produce different ratios.
Interpret expectations and risk
A high P/E can reflect expectations for growth, perceived durability, low interest rates, or enthusiasm. A low P/E can indicate slower prospects, cyclical peak earnings, financial risk, or pessimism. Neither label proves overvaluation or undervaluation.
Compare companies with similar business models and accounting economics, and examine the same earnings period. Capital-intensive companies, banks, and early-stage businesses may require different metrics. A company with a net loss does not have a conventional positive P/E.
Name the version
Trailing P/E uses reported earnings, which are known but backward-looking. Forward P/E uses analyst or company estimates, which can be revised or wrong. Cyclically adjusted versions average earnings over longer periods. Data services may therefore show different valid numbers on the same day.
P/E omits debt, cash, earnings quality, and the amount reinvested. It should be combined with growth assumptions, balance-sheet analysis, cash flow, margins, and competitive position. A ratio is a prompt for research, not a standalone buy or sell signal.
Hypothetical example
A share at $48 with trailing EPS of $3 has a trailing P/E of 16. If analysts estimate next-year EPS of $4, its forward P/E is 12. The lower forward number depends on the estimate coming true; it does not mean the share price has become cheaper today or that returns are assured.
Limitations to keep in mind
- Forward earnings are estimates and can change sharply.
- One-time items and differing EPS definitions can distort comparisons.
- Negative or near-zero earnings make P/E unusable or extreme, and a low ratio can be a warning rather than a bargain.
Sources and further reading
- P/E ratio Definition — Nasdaq
- P/E Ratio — Fidelity
Published ; Reviewed . Automated editorial source comparison; no external certification Claims compared with cited sources: 1
Nasdaq's glossary allows trailing or expected EPS; Fidelity's displayed formula emphasizes the last four quarters while discussing interpretation. The article requires the version to be named.